How Accurate is FFMI ? Truth & Limitations 2026
FFMI is either the most useful body composition metric available or a number that gives you false confidence. Which one depends entirely on one thing you probably never thought about.
That one thing is not the formula. The formula is simple math and it works every time. The accuracy problem lives somewhere else entirely.
This guide gives you the complete, honest picture of what FFMI gets right, where it falls apart, and exactly how accurate your score actually is based on how you measured your body fat.
Key Takeaways
- FFMI accuracy depends almost entirely on body fat measurement accuracy, not the formula itself
- If your body fat percentage is accurate within ±2%, your FFMI will be accurate within ±1 point
- BIA smart scales carry ±5-8% body fat error, making your FFMI potentially off by 2-3 points
- FFMI measures fat-free mass, not pure muscle mass, and fat-free mass includes water, glycogen, bone, and organs
- Skeletal muscle makes up approximately 45% of total fat-free mass in men, meaning FFMI is a proxy for muscularity, not a direct measurement
- For people shorter than 5’4″ or taller than 6’4″, normalized FFMI models become less reliable due to the 1.8m reference population
What Does FFMI Actually Measure?
Before discussing accuracy, you need to understand what FFMI is actually measuring because most people get this wrong.
FFMI does not measure muscle mass.
It measures fat free mass, which includes everything in your body except fat tissue. That means skeletal muscle, yes. But also water, glycogen stored in your muscles and liver, bone mineral density, organ mass, and connective tissue.
According to Lyle McDonald’s analysis on BodyRecomposition.com, skeletal muscle accounts for approximately 45% of total fat-free mass in men and slightly less in women due to higher organ mass relative to body size.
This matters because a pound of fat-free mass is not the same as a pound of muscle. If you drink a litre of water before measuring, your fat-free mass goes up. If you carb load the night before and flood your muscles with glycogen, your fat-free mass goes up. Neither of those situations means you built more muscle.
BodySpec, which operates DEXA scanning facilities and analyzes thousands of body composition scans annually, confirms that water makes up approximately 70 to 75% of lean mass according to Lorenzo et al. (2019). Hydration fluctuations can and do shift your FFMI reading even when your actual muscle mass has not changed.
FFMI works as a useful proxy for muscularity because muscle is the largest component of fat-free mass and changes in fat-free mass over time closely track real muscle changes. But calling FFMI a direct measurement of muscle mass is technically inaccurate.
Here is the practical takeaway. When you track your FFMI over months and years, the trend reflects real muscle gain or loss reasonably well. When you try to read too much into a single FFMI measurement, the non-muscle components of fat-free mass create noise.
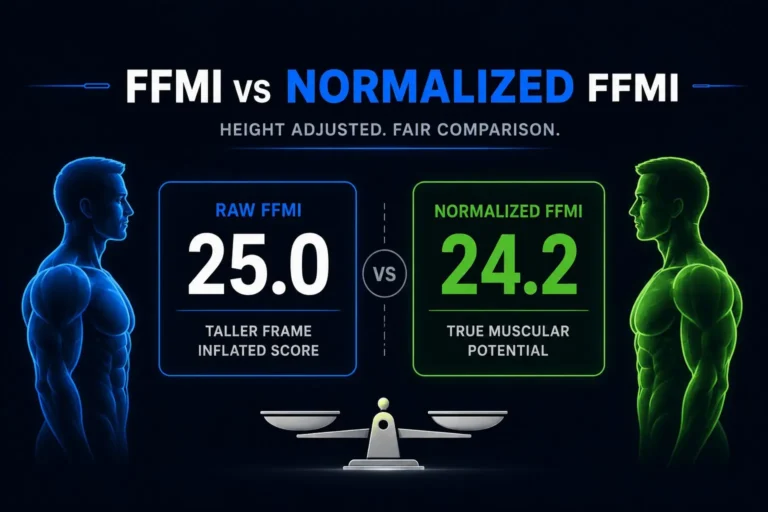
If you are unsure whether to use raw or normalized FFMI for your calculations, our guide on FFMI vs Normalized FFMI explains exactly which number to use and when.
The Real Accuracy Problem Nobody Explains
Here is what every article on FFMI accuracy misses.
The formula itself is not the problem. The formula takes your lean body mass, divides it by your height squared, and adds a height correction. That math is exact. No rounding error. No approximation. Given correct inputs, it produces a correct output every time.
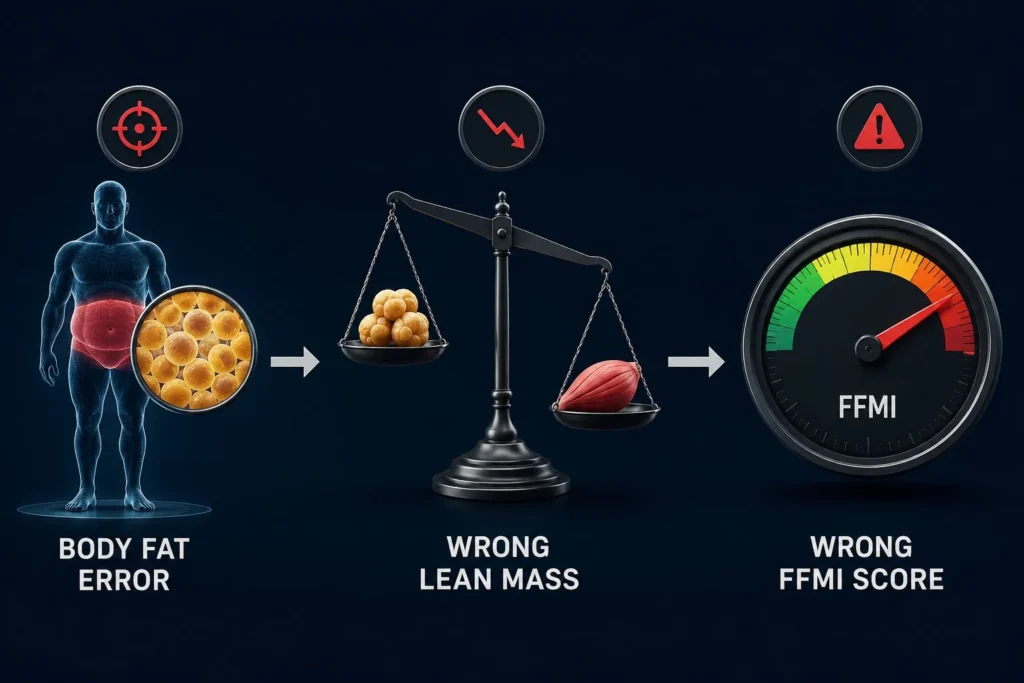
The accuracy problem is entirely in the inputs specifically, your body fat percentage.
Think about how FFMI is calculated. You multiply your total body weight by your body fat percentage to find fat mass. You subtract that from total weight to get lean mass. Then the formula runs on that lean mass number.
If your body fat percentage is wrong by 3%, your lean mass calculation is wrong by that proportion of your total weight. A 180 pound person with a 3% body fat error carries a lean mass error of roughly 5.4 pounds. That shifts their FFMI by approximately 0.8 to 1.2 points depending on height.
For a metric where the natural ceiling is 25 and the suspicious range starts around 26 to 27, an error of 1 to 2 FFMI points is not trivial. It is the difference between conclusions.
I learned this the hard way when I switched from a BIA smart scale to DEXA for my body composition measurements. My body fat reading dropped by nearly 4 percentage points from the smart scale to the scan, which meant my FFMI went up by almost a full point without any actual change in my physique. The scale was consistently overestimating my body fat, which was consistently deflating my FFMI.
How Accurate Is FFMI With Each Measurement Method?
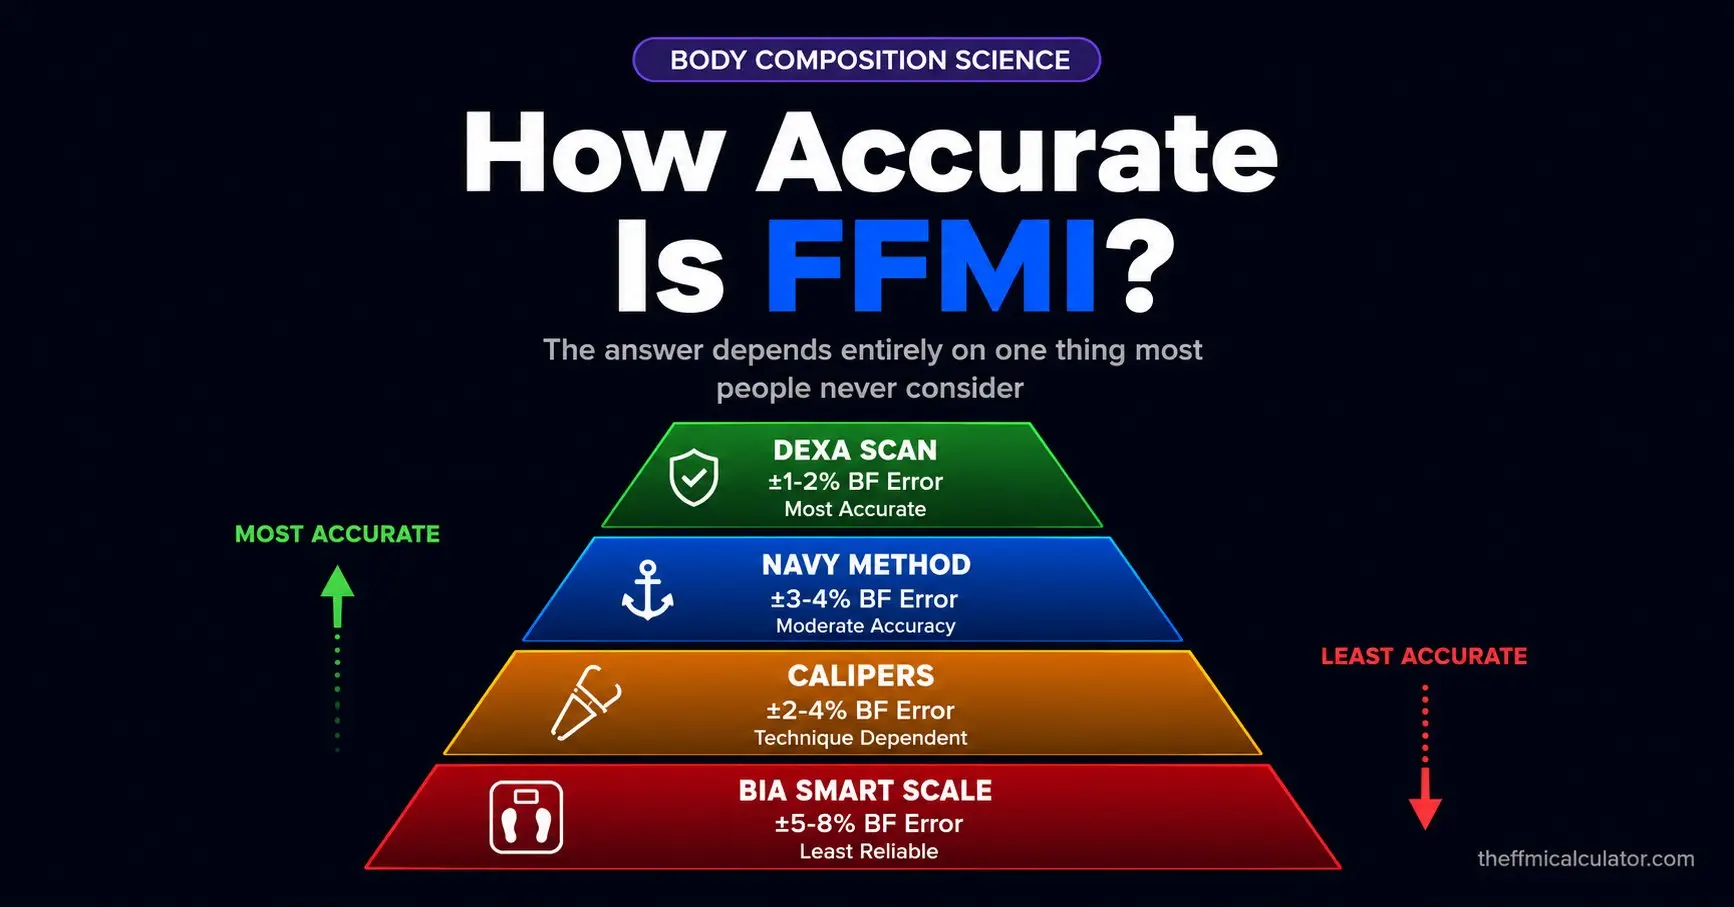
The accuracy of your FFMI score is directly determined by which method you use to measure body fat. Here is the honest breakdown:
DEXA Scan (Most Accurate One)
DEXA provides body fat accuracy of ±1 to 2%. At this level of precision, your FFMI will be accurate within ±0.5 to 1 point. For a tool like FFMI where individual point differences matter, this is the level of accuracy you need for meaningful comparisons to research standards.
A 2024 study published in the British Journal of Radiology comparing DEXA against CT scans in 103 adults found DEXA closely matched CT results for both fat mass and lean mass measurements in limbs and abdomen. This confirms DEXA as the gold standard reference for FFMI calculation.
DEXA gives you a reliable FFMI. Use it quarterly for benchmarking.
US Navy Circumference Method (Moderate Accuracy)
The Navy Method provides body fat accuracy of ±3 to 4% when measurements follow the correct protocol. This translates to an FFMI accuracy of approximately ±1 to 1.5 points.
For most practical purposes, tracking personal progress, rough comparisons — this level of accuracy is sufficient. But comparing your Navy Method based FFMI to research thresholds introduces meaningful uncertainty.
Skinfold Calipers (Moderate Accuracy, Technique-Dependent)
Skinfold calipers using the Jackson Pollock 3-site formula reach approximately ±2 to 4% accuracy when a skilled, consistent practitioner performs all measurements. This gives FFMI accuracy of roughly ±1 to 1.5 points under ideal conditions.
The critical limitation is practitioner consistency. Self measuring with calipers produces unreliable results because you cannot pinch yourself at the exact same site and angle every time.
BIA Smart Scales (Least Reliable)
A 2021 study published in JMIR mHealth and uHealth by Frija Masson et al. tested three commercially available smart scales against DEXA and found fat mass errors ranging from 2.2 to 8.0 kg across devices. Hydration alone can shift BIA body fat readings by 4 percentage points or more.
Loenneke et al. (2012) tested BIA against DEXA in 33 male baseball players and 16 female gymnasts and found BIA was not a valid estimate of FFMI compared to DEXA. For males, BIA gave an average FFMI of 20.6 while DEXA measured 21.1 a consistent underestimation.
At ±5 to 8% body fat error, BIA can shift your FFMI by 2 to 3 points. This makes BIA-derived FFMI scores unreliable for any comparison that requires precision.
Summary Table
| Method | Body Fat Accuracy | FFMI Accuracy | Reliability |
|---|---|---|---|
| DEXA Scan | ±1-2% | ±0.5-1 point | High |
| Navy Method | ±3-4% | ±1-1.5 points | Moderate |
| Skinfold Calipers | ±2-4% | ±1-1.5 points | Moderate |
| BIA Smart Scale | ±5-8% | ±2-3 points | Low |
Not sure which body fat measurement method is right for you? Our complete guide on how to calculate body fat percentage ranks every method by accuracy, cost, and practical accessibility.
What FFMI Gets Right
Despite its limitations, FFMI remains the most useful body composition metric available for natural lifters and sports scientists. Here is why it works.
It removes height bias from muscle comparisons. Two people of different heights cannot meaningfully compare raw lean mass. FFMI divides by height squared, creating a standardized score. A 5’6″ person at FFMI 23 and a 6’2″ person at FFMI 23 have equivalent muscularity relative to their frames, even though the taller person carries significantly more absolute lean mass.
It tracks real progress reliably over time. Even though fat free mass includes non-muscle components, the trend of your FFMI over months and years closely mirrors actual muscle gain when you use the same measurement method consistently. Lyle McDonald and Alan Aragon, two of the most respected researchers in body recomposition, both endorse FFMI as the most practical available tool for tracking natural muscular development.
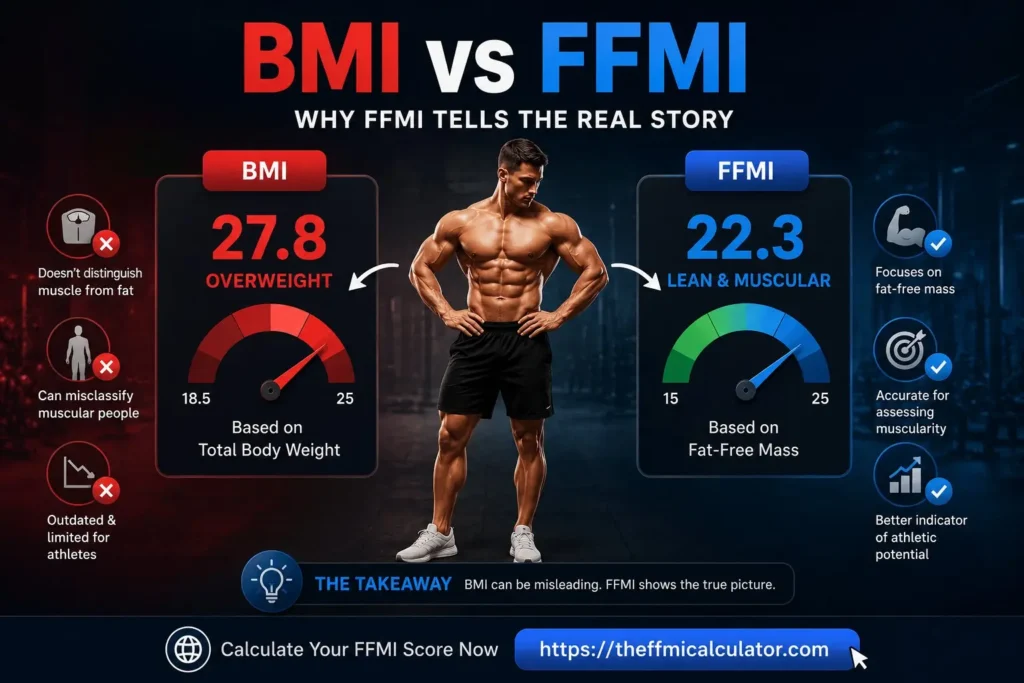
It outperforms BMI for athletic populations. BMI cannot distinguish fat from muscle, producing absurd results for trained athletes. A 2025 narrative review by Christodoulatos et al. published in Obesity Reviews found that fat-free mass index and fat mass index together provide a more comprehensive and accurate body composition picture than BMI alone, particularly for resistance-trained individuals where BMI consistently misclassifies muscularity as obesity.
It provides a statistically validated benchmark for natural limits. The Kouri et al. 1995 study remains valid research 30 years after publication. No natural lifter in their sample of 74 drug-free athletes exceeded normalized FFMI 25. Multiple follow-up studies have confirmed the pattern. For population-level probability assessments, the benchmark holds.
Where FFMI Falls Short
FFMI does not directly measure skeletal muscle. As established earlier, skeletal muscle represents approximately 45% of total fat-free mass. The rest is water, glycogen, bone, organs, and connective tissue. An FFMI increase does not confirm muscle gain it confirms fat-free mass gain, which is usually but not always driven by muscle.
It works best within a specific body fat range. The FFMI formula was derived from and validated against lean athletes — the original Kouri 1995 study population consisted almost entirely of competitive bodybuilders in contest condition. This means the formula is most accurate for men in the 4 to 12% body fat range and women in the 12 to 20% range. Outside these ranges, accuracy decreases meaningfully. At higher body fat levels, fat-free mass includes proportionally more water and glycogen relative to actual muscle tissue, which inflates the FFMI reading. If you are measuring your FFMI at 25% body fat, treat the number as a rough directional estimate rather than a precise score.
Short-term fluctuations create noise. Glycogen loading before a measurement inflates fat-free mass. Dehydration before a measurement deflates it. A hard training session causes muscle swelling from microtrauma, temporarily increasing lean mass readings. These fluctuations are real but irrelevant to actual muscle content.
The normalization model has height limitations. According to BodySpec’s analysis, very tall individuals above 6’4″ and very short individuals below 5’4″ may not fit the normalized FFMI model well. The 1.8-meter reference height used in the Kouri study came from an average height population. At extreme heights, the linear adjustment factor of 6.3 per meter may not accurately represent how muscle potential scales with height.
It does not account for frame size. Two people of identical height can have dramatically different skeletal frame sizes, with wider framed individuals capable of carrying more lean mass. The Casey Butt model addresses this by incorporating wrist and ankle circumference, but standard FFMI does not.
Age affects interpretation. Muscle mass naturally declines starting around age 30 due to sarcopenia. An FFMI of 22 means something very different for a 25-year-old versus a 55-year-old. The research benchmarks were derived primarily from younger athletic populations.
Is FFMI Accurate Enough for Natty or Not Assessments?
This is the question most people are actually asking and the honest answer is: it depends.
FFMI above 25 raises the probability of steroid use. It does not prove it.
The Kouri study established that no natural lifter in their sample exceeded 25. But the researchers themselves described their findings as preliminary and their sample of 74 natural athletes is too small to define the absolute limits of human genetic potential. Pre-steroid era Mr. America winners averaged normalized FFMI 25.4 naturally.
Here is what makes FFMI useful for natty assessments despite these limitations. The combination of factors matters more than the number alone. FFMI above 25 combined with very low body fat, year round leanness, disproportionate trap and shoulder development, and rapid lean mass gains creates a pattern that is difficult to explain naturally. Any single factor in isolation is weak evidence. The combination is much stronger.
The other issue is measurement error. If someone claims FFMI 24.5 based on a BIA smart scale body fat reading, that number could represent anywhere from FFMI 21.5 to 27.5 depending on the true body fat percentage. You simply cannot draw meaningful conclusions from imprecise measurements.
Bottom line: FFMI is a useful screening signal for enhanced physiques. It is not a verdict. Use accurate measurement methods, combine FFMI with other indicators, and interpret results as probability rather than proof.
How to Make Your FFMI Score as Accurate as Possible
Use DEXA for your baseline. Book a scan once and use it as your reference point. DEXA gives you the most accurate body fat percentage available without a research lab, which gives you the most accurate FFMI calculation possible.
Use the Navy Method for monthly tracking. It is free, takes five minutes, and produces results within ±3 to 4% of DEXA when done correctly. For tracking your own progress over time, this level of accuracy is more than sufficient.
Standardize your measurement conditions. Measure at the same time of day, same hydration status, same time since your last meal. Morning, fasted, after using the bathroom, before training is the most reproducible protocol.
Avoid measuring after unusual circumstances. Do not measure the day after a high carbohydrate refeed. Do not measure the morning after an unusually intense training session. Do not measure when you are dehydrated. These conditions inflate or deflate fat-free mass without reflecting real changes in muscle tissue.
Track the trend, not the number. A single FFMI reading tells you almost nothing. Six months of consistent measurements with the same method tell you whether you are building lean mass or not.
FAQ
At what body fat percentage is FFMI most accurate?
FFMI is most accurate for men in the 4 to 12% body fat range and for women in the 12 to 20% range. This is the population the original Kouri 1995 study was conducted on competitive bodybuilders in contest condition. Outside these ranges, particularly at higher body fat levels, fat-free mass includes more water and glycogen relative to actual muscle, which inflates the reading. If you are above 20% body fat as a man, treat your FFMI as a rough directional estimate rather than a precise measurement.
How accurate is FFMI?
FFMI accuracy depends almost entirely on body fat measurement accuracy. Using DEXA scan body fat data (±1-2% accuracy), FFMI is reliable within ±0.5 to 1 point. Using BIA smart scales (±5-8% accuracy), FFMI can be off by 2 to 3 points in either direction. The formula itself introduces no error, only the body fat input does.
Does FFMI measure actual muscle mass?
No. FFMI measures fat-free mass, which includes skeletal muscle, water, glycogen, bone, organs, and connective tissue. According to Lyle McDonald’s analysis, skeletal muscle accounts for approximately 45% of total fat-free mass in men. FFMI works as a reliable proxy for muscularity over time but does not directly measure muscle tissue.
Can smart scales give accurate FFMI readings?
No. The 2021 JMIR mHealth study by Frija-Masson et al. found fat mass errors of 2.2 to 8.0 kg in three tested smart scales compared to DEXA. Loenneke et al. (2012) confirmed BIA underestimates FFMI compared to DEXA in collegiate athletes. Smart scales are useful for tracking body weight but not reliable enough for meaningful FFMI calculation.
Why does my FFMI change day to day without changing my diet or training?
Short-term FFMI fluctuations are driven by hydration status, glycogen storage, and muscle swelling from training. All of these affect fat-free mass without changing actual muscle tissue. BodySpec confirms water makes up 70 to 75% of lean mass according to Lorenzo et al. (2019). Small hydration shifts create measurable FFMI changes that do not reflect real body composition changes.
Is FFMI 25 an accurate cutoff for natural status?
FFMI 25 is a statistically derived threshold from the Kouri 1995 study of 74 natural athletes none of whom exceeded this mark. However, pre steroid era competitors averaged 25.4 naturally, and the researchers themselves called the finding preliminary. FFMI 25 is a useful probability signal, not a biological absolute. Combined with body fat percentage, rate of gains, and physical indicators, it forms part of a useful assessment framework.
How can I improve my FFMI measurement accuracy?
Use DEXA scan for your baseline body fat measurement. Track monthly progress with the US Navy circumference method. Always measure under identical conditions — same time, same hydration, same time since last meal. Never compare measurements taken with different methods or under different conditions.
Is FFMI better than BMI for athletes?
Yes, significantly. BMI cannot distinguish muscle from fat, producing misleading results for trained individuals. A 2025 narrative review by Christodoulatos et al. in Obesity Reviews confirmed FFMI and fat mass index together provide a more accurate body composition assessment than BMI for resistance-trained populations. FFMI isolates lean mass from fat mass, making it far more informative for anyone who trains consistently.
Conclusion
FFMI is accurate when you give it accurate inputs and interpret its output correctly.
Use precise body fat measurement. Track the trend over time. Combine it with other data points when drawing conclusions. That combination makes FFMI one of the most useful body composition tools available, not despite its limitations, but because you now understand exactly where those limitations live.
References
- Frija-Masson J, Mullaert J, Vidal-Petiot E, et al. Accuracy of Smart Scales on Weight and Body Composition: Observational Study. JMIR mHealth and uHealth. 2021;9(4):e22487.
- Loenneke JP, Wilson JM, Wray ME, et al. The estimation of the fat free mass index in athletes. Asian Journal of Sports Medicine. 2012;3(3):200-203. PMC3445648.
- Kouri EM, Pope HG Jr, Katz DL, Oliva P. Fat-free mass index in users and nonusers of anabolic-androgenic steroids. Clinical Journal of Sport Medicine. 1995;5(4):223-228.
- Oh J, Chae HD, Yoo HJ, Choi JY, Hong SH. Direct Regional Comparison of Whole-Body DXA and Whole-Body CT Measurements of Fat Mass and Fat-Free Mass in Limbs and Abdomen. British Journal of Radiology. 2025.
- Fields JB, Jones MT, Feit A, et al. Fat-Free Mass Index in a Large Sample of Collegiate American Football Athletes. International Journal of Exercise Science. 2024;17(4):129-139.
- Lorenzo I, Serra-Prat M, Yébenes JC. The Role of Water Homeostasis in Muscle Function and Frailty: A Review. Nutrients. 2019;11(8):1857.
- Batrakoulis A, Jamurtas AZ, Metsios GS, et al. Comparative Efficacy of 5 Exercise Types on Body Weight and Composition in Adults with Overweight and Obesity. Circulation: Cardiovascular Quality and Outcomes. 2022;15(5):e008585.
- Christodoulatos GS, Spyrou N, Kadillari J, Psaltopoulou T, Dalamaga M. Fat-Free Mass: Friend or Foe to Metabolic Health? A Narrative Review. Obesity Reviews. 2025. PMC11788497.
- Schutz Y, Kyle UG, Pichard C. Fat-free mass index and fat mass index percentiles in Caucasians aged 18 to 98 years. International Journal of Obesity. 2002;26:953-960.
- VanItallie TB, Yang MU, Heymsfield SB, et al. Height-normalized indices of the body’s fat-free mass and fat mass. American Journal of Clinical Nutrition. 1990;52(6):953-959.
- Nuttall FQ. Body Mass Index: Obesity, BMI, and Health: A Critical Review. Nutrition Today. 2015;50(3):117-128.