

FFMI vs Normalized FFMI | What Is the Difference and Which One Actually Matters?
Most people calculating their FFMI are comparing the wrong number to the wrong standard and drawing completely wrong conclusions as a result.
Here is the problem. You calculate your raw FFMI, get 25.2, and immediately think you have hit the natural ceiling. But if you are 6 feet 3 inches tall, your normalized FFMI is actually 24.4. You are not at the ceiling. You are below it. The internet just never explained the difference clearly enough.
This guide fixes that. You will understand exactly what both numbers mean, how to calculate each one, and which one to use in every situation.

Not sure what your FFMI is? Use our free FFMI Calculator to get your FFMI score in 30 seconds.
Key Takeaways
- Raw FFMI measures your lean body mass divided by height squared, it does not account for height differences between people
- Normalized FFMI adjusts everyone’s score to what it would be at 1.8 meters (5’11”) tall, creating a fair comparison across different heights
- The famous “25 natural limit” from the Kouri 1995 study uses normalized FFMI, not raw FFMI
- Taller people get a lower normalized FFMI than their raw score. Shorter people get a higher one.
- For tracking your own progress over time, raw FFMI works fine. For comparing yourself to others or published research, always use normalized FFMI.
- Mixing raw FFMI with normalized standards is the most common mistake and it leads to completely wrong conclusions
What Is Raw FFMI and What Does It Actually Measure?
Raw FFMI: Fat-Free Mass Index is a body composition metric that measures how much lean body mass you carry relative to your height. It strips out body fat and looks only at muscle, bone, organs, and water.
The formula is straightforward:
FFMI = Lean Body Mass (kg) divided by Height squared (m²)
Lean Body Mass = Total Weight x (1 minus Body Fat as a decimal)
Example: If you weigh 80 kg, carry 15% body fat, and stand 1.78 meters tall:
Lean Body Mass = 80 x 0.85 = 68 kg FFMI = 68 divided by (1.78 x 1.78) = 68 divided by 3.17 = 21.5
Raw FFMI is useful. It tells you far more than BMI, which cannot distinguish muscle from fat. But raw FFMI has one significant problem. It does not account for height.
A taller person naturally carries more lean body mass just because they have a larger frame — more bone, more muscle to fill a bigger structure. That means a 6’4″ person will almost always have a higher raw FFMI than a 5’6″ person, even if they are equally muscular relative to their size. The number is biased toward height, and that makes comparison unfair.
That is exactly why normalized FFMI exists.
What Is Normalized FFMI? Meaning, Formula, and Why It Exists
Normalized FFMI is a height-adjusted version of raw FFMI that allows fair comparison between people of different heights. It mathematically adjusts your score to what it would be if you were exactly 1.8 meters (5’11”) tall.
The normalized FFMI formula, derived from the original Kouri et al. 1995 study:
Normalized FFMI = FFMI + 6.3 x (1.8 minus Height in meters)
Some calculators use 6.1 instead of 6.3. Both coefficients are widely cited in the literature and the practical difference between them is negligible roughly 0.02 to 0.04 FFMI points. Either is acceptable. Choose one and stay consistent.
Why 1.8 meters as the reference height?
The researchers chose 1.8 meters because it represented the average height of natural athlete subjects in the original 1995 Kouri study. At exactly 1.8 meters, your raw FFMI and normalized FFMI are identical — no adjustment needed.
Why 6.3 as the coefficient?
The coefficient was empirically derived from the Kouri study data through linear regression analysis. Researchers found that FFMI increases by approximately 0.6 to 0.7 points per 10 centimeters of height. The value 6.3 represents the adjustment needed per meter of height difference from the 1.8 meter reference. Some sources cite 6.1 as the original value — the disagreement in literature is genuine, but the practical impact on your score is less than 0.05 FFMI points regardless of which you use.
Here is how the direction of adjustment works:
Shorter than 1.8m: Normalized FFMI is higher than raw FFMI (compensates for your smaller frame) Exactly 1.8m: No adjustment — normalized equals raw FFMI Taller than 1.8m: Normalized FFMI is lower than raw FFMI (adjusts downward for your larger frame)
This is where most people get confused. If you are tall, your normalized FFMI is actually lower than your raw FFMI, not higher. The formula penalizes larger frames to create fairness.
How Does Height Actually Affect Your FFMI Score?
This is the part most articles skip entirely.
Taller individuals can carry more absolute lean body mass simply because they have more frame to fill. That is not superior muscularity it is physics. A 6’4″ person has longer bones, bigger joints, and a larger skeletal structure than a 5’6″ person. They will naturally accumulate more absolute muscle mass even with identical genetics and training.
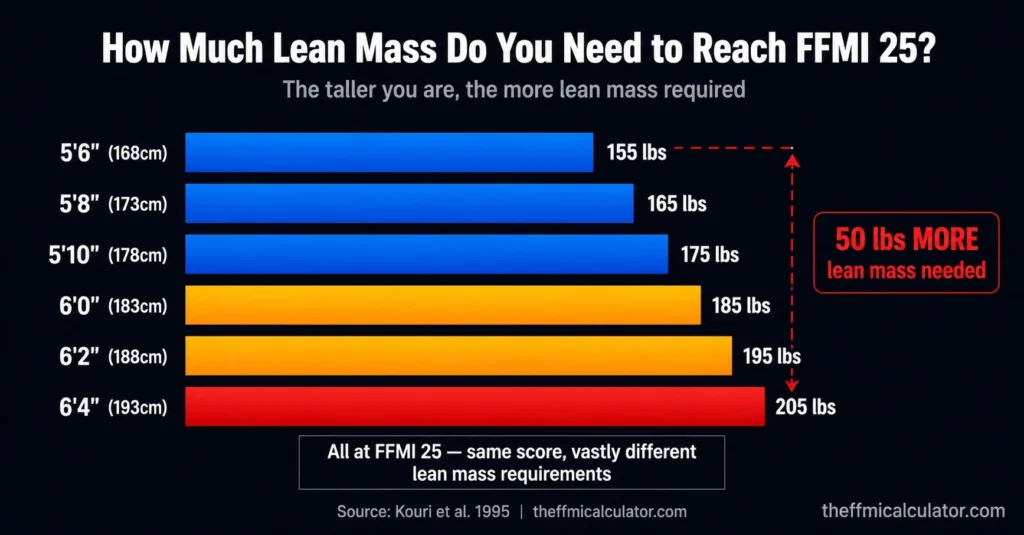
Here is exactly how much lean mass you need at different heights to reach FFMI 25:
| Height | To Reach FFMI 25 | Fat-Free Mass Required | Total Weight at 10% BF |
|---|---|---|---|
| 5’6″ (168 cm) | FFMI 25 | 70.5 kg (155 lbs) | 172 lbs |
| 5’8″ (173 cm) | FFMI 25 | 74.8 kg (165 lbs) | 183 lbs |
| 5’10” (178 cm) | FFMI 25 | 79.2 kg (175 lbs) | 194 lbs |
| 6’0″ (183 cm) | FFMI 25 | 83.7 kg (185 lbs) | 206 lbs |
| 6’2″ (188 cm) | FFMI 25 | 88.4 kg (195 lbs) | 217 lbs |
| 6’4″ (193 cm) | FFMI 25 | 93.1 kg (205 lbs) | 228 lbs |
A 6’4″ person needs to carry 50 pounds more total weight than a 5’6″ person to achieve the same raw FFMI of 25. That is not more muscular that is just more frame.
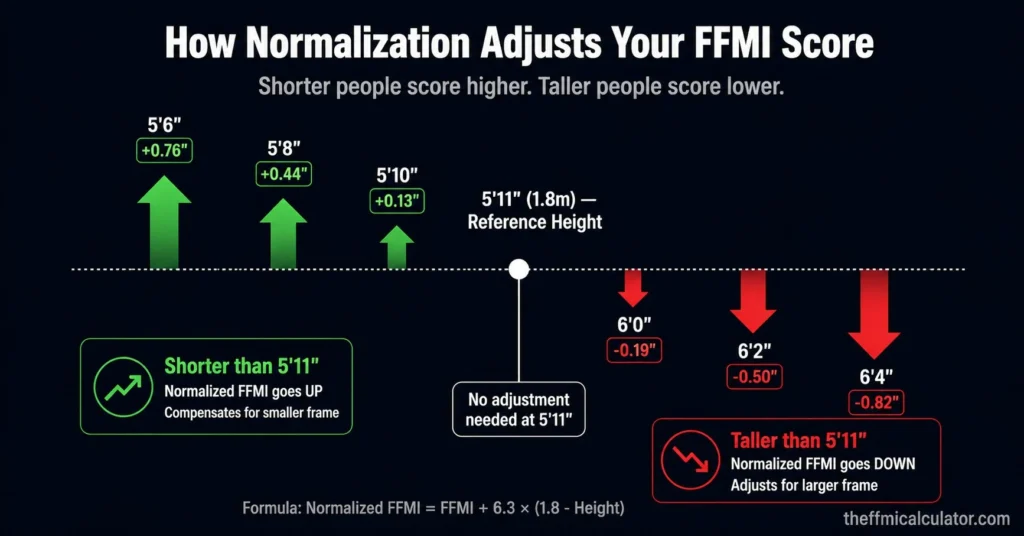
Here is the normalization adjustment by height:
| Height | Adjustment | Effect | Example |
|---|---|---|---|
| 5’6″ (168 cm) | +0.76 | Increases FFMI | Raw 23.0 becomes Normalized 23.76 |
| 5’8″ (173 cm) | +0.44 | Increases FFMI | Raw 23.0 becomes Normalized 23.44 |
| 5’10” (178 cm) | +0.13 | Minimal Change | Raw 23.0 becomes Normalized 23.13 |
| 6’0″ (183 cm) | -0.19 | Decreases FFMI | Raw 23.0 becomes Normalized 22.81 |
| 6’2″ (188 cm) | -0.50 | Decreases FFMI | Raw 23.0 becomes Normalized 22.50 |
| 6’4″ (193 cm) | -0.82 | Decreases FFMI | Raw 23.0 becomes Normalized 22.18 |
The pattern is consistent. Shorter than 5’11” normalization adds to your score. Taller than 5’11” normalization subtracts from your score. This creates a level playing field regardless of height.
FFMI vs Normalized FFMI: How to Calculate Both Step by Step
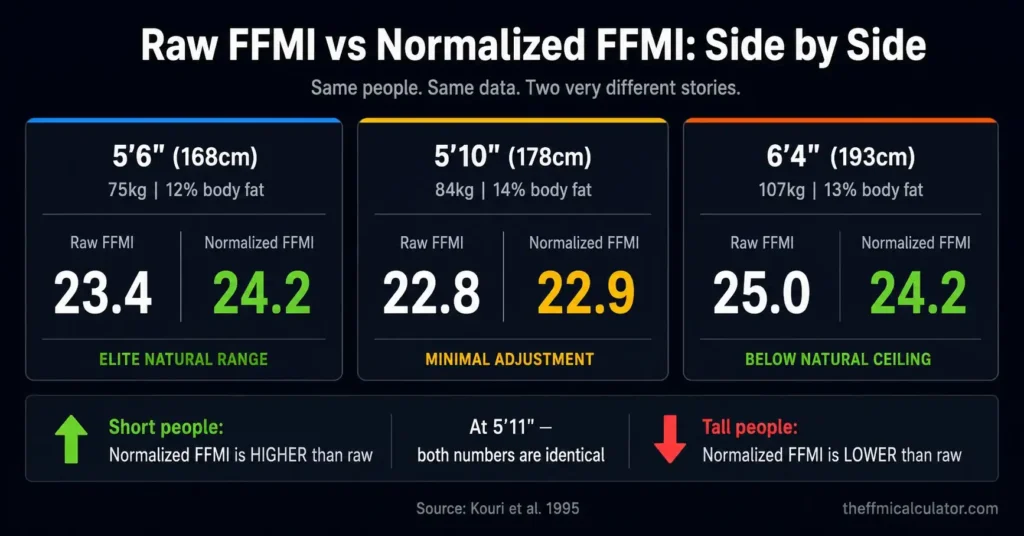
Here are three worked examples across different heights so you can see exactly how the two numbers diverge.
Example 1: Short Male (5’6″ / 168cm)
Height: 1.68m, Weight: 75 kg, Body Fat: 12%
Step 1: Calculate Lean Body Mass 75 x (1 minus 0.12) = 75 x 0.88 = 66 kg
Step 2: Calculate Raw FFMI 66 divided by (1.68 x 1.68) = 66 divided by 2.82 = 23.4
Step 3: Calculate Normalized FFMI 23.4 + 6.3 x (1.8 minus 1.68) = 23.4 + 6.3 x 0.12 = 23.4 + 0.76 = 24.2
Raw FFMI of 23.4 looks good but not exceptional. Normalized FFMI of 24.2 reveals this person is actually approaching the natural genetic ceiling. The normalization compensates for the smaller frame and shows true muscularity.
Example 2: Average Male (5’10” / 178cm)
Height: 1.78m, Weight: 84 kg, Body Fat: 14%
Step 1: Calculate Lean Body Mass 84 x (1 minus 0.14) = 84 x 0.86 = 72.2 kg
Step 2: Calculate Raw FFMI 72.2 divided by (1.78 x 1.78) = 72.2 divided by 3.17 = 22.8
Step 3: Calculate Normalized FFMI 22.8 + 6.3 x (1.8 minus 1.78) = 22.8 + 6.3 x 0.02 = 22.8 + 0.13 = 22.9
At nearly the reference height, raw and normalized FFMI are almost identical. This person experiences minimal adjustment from normalization — which makes sense because they are close to the 1.8m reference point.
Example 3: Tall Male (6’4″ / 193cm)
Height: 1.93m, Weight: 107 kg, Body Fat: 13%
Step 1: Calculate Lean Body Mass 107 x (1 minus 0.13) = 107 x 0.87 = 93.1 kg
Step 2: Calculate Raw FFMI 93.1 divided by (1.93 x 1.93) = 93.1 divided by 3.72 = 25.0
Step 3: Calculate Normalized FFMI 25.0 + 6.3 x (1.8 minus 1.93) = 25.0 + 6.3 x (-0.13) = 25.0 minus 0.82 = 24.2
Raw FFMI of 25.0 exactly hits the “natural limit.” But normalized FFMI of 24.2 shows this person is actually below the ceiling. Without normalization, you would conclude this person is at the natural limit. With normalization, you see they have room to grow.
The side by side comparison:
Without normalization: 5’6″ person FFMI 23.4 (appears less muscular), 5’10” person FFMI 22.8, 6’4″ person FFMI 25.0 (appears most muscular)
With normalization: 5’6″ person 24.2 (elite development), 5’10” person 22.9 (excellent), 6’4″ person 24.2 (elite development)
The 5’6″ and 6’4″ individuals have equivalent muscularity relative to their frames, despite the tall person carrying 70 pounds more total weight. Normalization reveals this. Raw FFMI hides it.
What Is the Difference Between FFMI and Normalized FFMI?
Here is the direct comparison:
| Factor | Raw FFMI | Normalized FFMI |
|---|---|---|
| Formula | Lean mass divided by height squared | Raw FFMI + 6.3 × (1.8 − height) |
| Height Adjustment | None | Adjusted to 1.8m reference |
| Fair Across Heights | No | Yes |
| Best For | Personal progress tracking | Comparing to others and research |
| Natural Limit Reference | Not applicable | 25 (Kouri 1995) |
| Taller People | Score is inflated | Score adjusted down |
| Shorter People | Score is deflated | Score adjusted up |
The core difference is this: raw FFMI tells you how much lean mass you carry for your height. Normalized FFMI tells you how muscular you are compared to everyone else, regardless of height differences.
Both numbers come from the same body composition data. The only difference is whether a height adjustment is applied.
Before comparing raw and normalized FFMI, it helps to understand how FFMI differs from lean body mass.
Which One Should You Use and When?
This is the question most articles dodge. Here is the direct answer.
Use normalized FFMI when:
You are comparing yourself to someone of a different height. Two training partners of different heights cannot meaningfully compare raw FFMI scores. Normalized FFMI creates the fair comparison.
You are applying published research standards. When the Kouri 1995 study says “FFMI 25 is the natural limit,” that number is normalized FFMI. When any research paper cites FFMI benchmarks, they are using normalized values. Comparing your raw FFMI to those numbers gives you a wrong answer.
You want to know where you stand relative to your genetic potential. Normalized FFMI adjusts for your height and gives you a comparable position on the natural muscular development scale.
You are evaluating natural vs enhanced status. The probability thresholds used in sports science all reference normalized FFMI.
Use raw FFMI when:
You are tracking your own progress over time. Your height does not change. So for personal tracking across months and years, raw FFMI is simpler and equally accurate. You do not need to normalize when comparing yourself to yourself.
Everyone you are comparing is a similar height. If your training group is all within 2 to 3 inches of each other, raw FFMI differences are small enough to be negligible.
You want a quick estimate without precision. Raw FFMI requires one fewer calculation step. For ballpark self-assessment, it works fine.
The rule of thumb: normalize when comparing across heights or to research. Use raw when tracking yourself.
The Most Common FFMI Mistake Nobody Talks About
Here is what I see constantly in fitness communities, Reddit threads, and YouTube comment sections.
Someone calculates their raw FFMI, gets 25.3, and immediately concludes they have hit the natural ceiling or that they must be enhanced. They are comparing a raw number to a normalized standard, and drawing a completely wrong conclusion.
I made this exact mistake myself when I first started tracking FFMI. I calculated my raw score, compared it to the Kouri study threshold, and spent weeks convinced I was approaching my genetic ceiling. Then I actually read the study. The 25 threshold is normalized. My raw score meant nothing without the height adjustment.
If that person is 6’3″ tall, their raw FFMI of 25.3 becomes a normalized FFMI of approximately 24.5. They are not at the natural limit. They are well within it.
If that same person is 5’6″ tall, their raw FFMI of 25.3 becomes a normalized FFMI of 26.1. Now the question becomes more interesting.
The same raw number tells completely different stories depending on height. And if you never apply normalization, you will never know which story applies to you.
Here is the practical fix. Whenever you read about FFMI thresholds — the 25 natural limit, the suspicious range above 26, anything from the Kouri study — assume those numbers are normalized. Then calculate your own normalized FFMI before comparing. Never compare raw to normalized. Always compare normalized to normalized.
This single habit eliminates the most common source of confusion in the entire FFMI conversation.
Does Normalization Have Any Limitations?
Normalization improves fairness significantly. But it is not a perfect system.
It assumes a linear height relationship. The formula assumes muscle potential scales linearly with height. Real biology is more complex — bone density, limb proportions, and leverages vary in ways the formula does not capture. For most people between 5’4″ and 6’4″, the linear approximation works well. For very short people below 5’4″ or very tall people above 6’6″, the model may not fit as accurately.
It does not account for frame size. Two people of the same height can have dramatically different bone structures. A wide-framed individual with thick wrists and ankles can carry significantly more muscle than a narrow-framed person of the same height. The Casey Butt model addresses this by incorporating wrist and ankle circumference, but normalized FFMI does not.
It was derived from a specific population. The 6.3 coefficient came from a sample of bodybuilders in 1995. That population may not perfectly represent all ethnicities, body types, or modern athletes who train and eat very differently from 1995 competitive bodybuilders.
Body fat measurement accuracy still matters. Normalization cannot fix inaccurate body fat input. If your body fat percentage is off by 5%, your raw FFMI is wrong and your normalized FFMI is equally wrong. Garbage in, garbage out applies regardless of which number you use.
Despite these limitations, normalized FFMI remains the best practical tool for height-adjusted muscular comparison. A 2024 study in the International Journal of Exercise Science by Fields et al. examining 111 NCAA Division III football players found mean FFMI of 23.50, with values ranging from 18.1 to 27.7, confirming that even in drug-tested collegiate athletes, individual variation is wide and the 25 threshold represents a strong signal, not an absolute wall.
For 95% of people between 5’4″ and 6’4″, normalized FFMI provides fair and accurate assessments of muscularity. Use it with the understanding that it is a statistical tool, not a biological verdict.
3 Common Myths About FFMI and Normalization
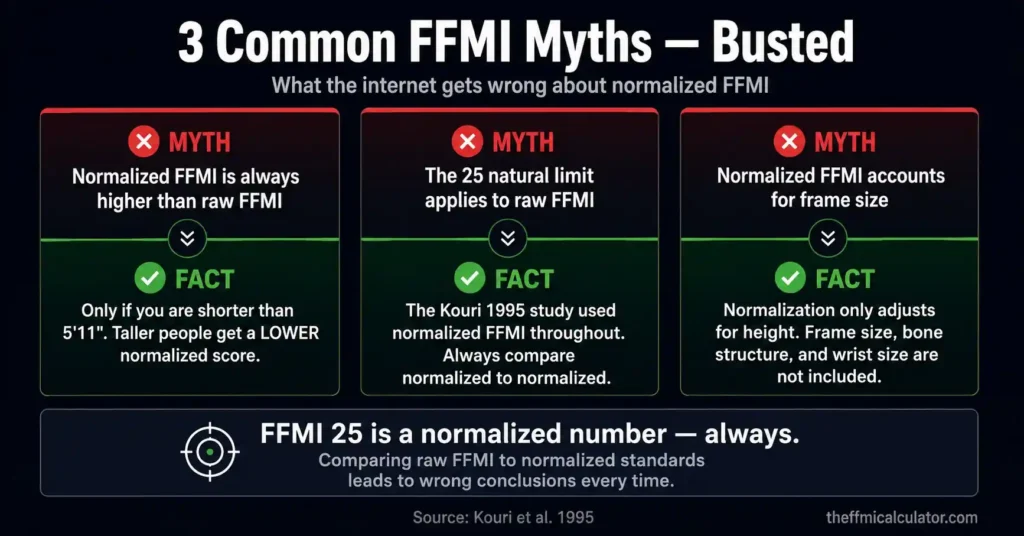
Myth 1: Normalized FFMI is always higher than raw FFMI
Wrong. If you are taller than 1.8 meters, normalization actually brings your score down. A 6’4″ person with raw FFMI 25.0 has a normalized FFMI of 24.2. Normalization goes both ways — up for shorter people, down for taller ones.
Myth 2: The 25 natural limit applies to raw FFMI
This is the most damaging myth in the fitness community. The Kouri 1995 study used normalized FFMI throughout. The 25 threshold is a normalized number. If you are tall and your raw FFMI exceeds 25, that does not automatically mean anything. Calculate your normalized score first.
The 25 natural limit is always normalized but is it actually a hard ceiling? Our detailed breakdown of the maximum natural FFMI limit answers that question completely.”
Myth 3: Normalized FFMI accounts for frame size
It does not. Normalization only adjusts for height. Two people of the same height can have completely different bone structures, wide vs narrow frame and normalized FFMI treats them identically. For a more frame specific estimate, the Casey Butt model uses wrist and ankle circumference, but that is a separate calculation altogether.
Frequently Asked Questions
What is the difference between FFMI and normalized FFMI?
Raw FFMI divides your lean body mass by your height squared. Normalized FFMI adds a height correction using the formula: Normalized FFMI = FFMI + 6.3 x (1.8 minus your height in meters). This adjustment makes scores comparable across different heights. At 1.8 meters (5’11”), both numbers are identical. Shorter people get a higher normalized score. Taller people get a lower one.
What is the normalized FFMI natural limit?
The Kouri et al. 1995 study established 25 as the normalized FFMI threshold beyond which steroid use becomes statistically likely. No natural lifter in their sample of 74 drug-free athletes exceeded this mark. However, the researchers called this finding preliminary, and pre-steroid era competitors like John Grimek reached normalized values slightly above 25 naturally. It is a strong probability signal, not a biological absolute.
Why use normalized FFMI instead of regular FFMI?
Because raw FFMI is biased toward taller people. A 6’4″ person naturally carries more lean body mass than a 5’6″ person just due to frame size. Without normalization, taller individuals always appear more muscular by the numbers. Normalized FFMI removes that height bias and reveals true muscularity relative to each person’s genetic potential.
Is FFMI 25 normalized or raw?
The “25 natural limit” is always normalized FFMI. It comes from the Kouri 1995 study, which used the normalized formula. If you are tall say 6’2″ or above — your raw FFMI can exceed 25 while your normalized FFMI sits below it. Comparing your raw FFMI to the 25 threshold is a mistake that leads to wrong conclusions.
What is the normalized FFMI formula?
Normalized FFMI = FFMI + 6.3 x (1.8 minus your height in meters). Some calculators use 6.1 instead of 6.3 — the difference is negligible (roughly 0.02 to 0.04 points). The 1.8 meter reference height was chosen because it was the average height of subjects in the original 1995 Kouri study.
Should I track raw or normalized FFMI for personal progress?
For tracking your own progress over time, raw FFMI is simpler and equally valid — your height does not change, so normalization adds no new information. For comparing yourself to others of different heights, or to published research thresholds, always use normalized FFMI. Most FFMI calculators provide both numbers; use raw for tracking and normalized for comparison.
What does a normalized FFMI of 25 mean?
A normalized FFMI of 25 places you at the statistical boundary identified by Kouri et al. (1995) as the approximate natural limit for men. Most natural lifters with exceptional genetics and 7 to 10 years of optimized training reach between 22 and 24. Reaching 25 requires elite genetics and represents a genuinely rare natural achievement. Above 25, the probability of performance enhancing drug use increases significantly, though it does not reach certainty.
Conclusion
Raw FFMI and normalized FFMI come from the same data. The only difference is a height adjustment that makes everything fairer and more meaningful.
Use raw FFMI to track your own progress over time, it is simpler and your height does not change. Use normalized FFMI when comparing yourself to others, applying research standards, or evaluating where you stand relative to your genetic potential.
The 25 natural limit is always normalized. Every research paper, every threshold, every bodybuilding benchmark you read about uses normalized FFMI. Comparing your raw score to those numbers is like measuring distance in miles and comparing it to a kilometer target — the units do not match.
Calculate your normalized FFMI. Compare it to normalized standards. Track your raw FFMI over time. That combination gives you the complete, accurate picture of your muscular development.
Now that you understand both numbers, the next step is improving them. Our complete guide on how to increase FFMI naturally gives you the exact strategy.
Refrences
- Kouri EM, Pope HG Jr, Katz DL, Oliva P. Fat-free mass index in users and nonusers of anabolic-androgenic steroids. Clinical Journal of Sport Medicine. 1995;5(4):223-228.
- Fields JB, Jones MT, Feit A, Magee MK, Kuhlman NM, Jagim AR. Fat-Free Mass Index in a Large Sample of Collegiate American Football Athletes. International Journal of Exercise Science. 2024;17(4):129-139.
- Trexler ET, Smith-Ryan AE, Mann JB, et al. Fat-free mass index in NCAA Division I and II collegiate American football players. Journal of Strength and Conditioning Research. 2017;31(10):2719-2727.
- Currier BS, Harty PS, Moon JM, et al. Fat-free mass index in a diverse sample of male collegiate athletes. International Journal of Exercise Science. 2019;11(6).
- VanItallie TB, Yang MU, Heymsfield SB, Funk RC, Boileau RA. Height-normalized indices of the body’s fat-free mass and fat mass. American Journal of Clinical Nutrition. 1990;52(6):953-959.
- Schutz Y, Kyle UG, Pichard C. Fat-free mass index and fat mass index percentiles in Caucasians aged 18 to 98 years. International Journal of Obesity. 2002;26:953-960.


